Simplifying Assumptions
Scenario 1: US energy consumption remains constant to 2035
This assumption feels rather delicate to me, as it seems to be formed relative to a different, though undoubtably important question of its own. So let me say a few words on this. It seems that one of the general motivations behind the movement for energy conservation in the United States at present takes as conventional wisdom the idea that US energy consumption is as large as it is primarily due to inefficient technologies coupled with a type of cultural and systematic excess endemic to the American lifestyle. There is even first order data that could be (possibly mis)-used to back this up, such as, for example, that from 2010 to 2012 the US energy consumption has witnessed a modest net decrease in annual rate according to the Energy Information Administration (EIA) , though the decade long trend remains quite positive.

One potential difficulty with this type of interpretation of the data is that it ignores the fact that we have seen similar dips multilpe times in the past 30 years in the US (in the early 80s, the early nineties, and the early 2000s, for example), none of which have necessaarily mitigated the fact that the trend since 1980 is unabashedly positive. Indeed EIA projections infer a steady increase in US energy consumption throughout the first half of the century.
But instead of being distracted by this question of whether the energy consumption of post-industrialized economies can continuously decrease over the next 25 year period or so (which will be addressed directly in a subsequent entry), let us take instead as a provisional predicate that: US energy consumption remains constant over the next 21 years. It seems that this assumption might be viewed as a relatively conservative first order approximation, and we will revisit it below in more detail. For now it is taken as a base assumption, along with the further assumption of a constant world and US population.
Another interesting facet of a perspective explored in “Can We Make a Star on Earth? ” documentary from the previous entry (see Beginning to Develop Intuition for Energy) is that it seems to require a second implicit assumption relative to its basic framing. That is, it seems that Cox is suggesting that energy consumption by analogy is a type of economic metric; a sort of measure of relative prosperity. This seems on first look like a reasonable idea, but I want to see if there is any basic statistical way of justifiying the analogy.
Consider by way of comparison the per capita gross domestic product in the USA, or the average annual wealth per unit person, which is about $52,000 per year. Remarkably the median US income is about 26,000 per year. The federal poverty line is defined by the US department of health as being around $13,000 per year averaged over the 50 states. Statistically, this means that those US citizens who make less than 25% of the average US income are by US standards, impoverished. So using this as a relative quantitative baseline for what it means to be impoverished in the US in terms of monetary wealth, let’s take a look at this same idea through the lens of relative energy consumption.
To do so, notice first that in 2010 the USA consumed about 98 quadrillion BTUs, which incidently is about 19% of the total energy consumed by the entire world in 2010, about 511 quadrillion BTUs. This works out to an average energy consumption in the USA of 10.6 kW per person, and similarly, a global average of 2.1 kW per person. That means that the average global citizen consumes about 23% of what the average US citizen consumes. If we apply our relative prosperity analogy here, then it follows that by internal USA standards of poverty the average global citizen persists in a type of relative energy poverty.
Indeed, on a close inspection separating concepts of poverty, resource availability, and monetary income from energy consumption is essentially impossible. I want to return to this in another entry in much greater detail, but just to provide a very short list of basic resources requiring large relative energy footprints, consider, for example: the purification and desalination of water, refridgeration, horticulture, heating, transport of produce, electric lighting, sanitation, healthcare, telecommunications, etc. The IEA (international energy agency) among others outlines energy poverty as a basic measure of human well-being and a crucial requirement for a country to achieve functional economic development.
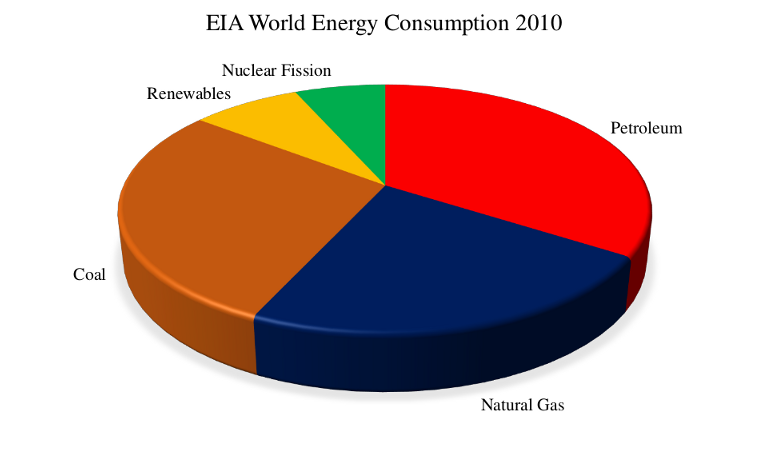
While energy povery covers the earth, inviting profound degradation in human well-being, world energy consumption continues to grow quite rapidly. And moreover, the EIA projects that these trends are expected to persist well into the 21st century. To take a snapshot of the state of our energy economy as of 2010, according to the EIA the world consumed 510.6 quadrillion BTUs, or 149.5 petawatt hours of energy. Over one year this means an average power of 17.1 tW globally. The consumed energy in 2010 was obtained from 174.9 quadrillion BTUs of petroleum, 117.1 quadrillion BTUs of natural gas, 146.7 quadrillion BTUs of coal, and 40.8 quadrillion BTUs of renewables, leaving about 34 quadrillion BTUs for nuclear fission. This was an energy consumption footprint of about 34% petroleum, 23% natural gas, 28% coal, 8% renewables and 7% nuclear power (for interesting reasons, nuclear energy often falls under the term environmentally responsible forms of low carbon or carbon neutral renewable energy).